
 EN
EN
 ar
ar bg
bg hr
hr cs
cs da
da nl
nl fi
fi fr
fr de
de el
el hi
hi it
it ko
ko no
no pl
pl pt
pt ro
ro ru
ru es
es sv
sv tl
tl iw
iw id
id lv
lv lt
lt sr
sr sk
sk sl
sl uk
uk vi
vi et
et hu
hu th
th tr
tr fa
fa ms
ms hy
hy ka
ka ur
ur bn
bn mn
mn ta
ta kk
kk uz
uz ku
ku
load cell connection diagram
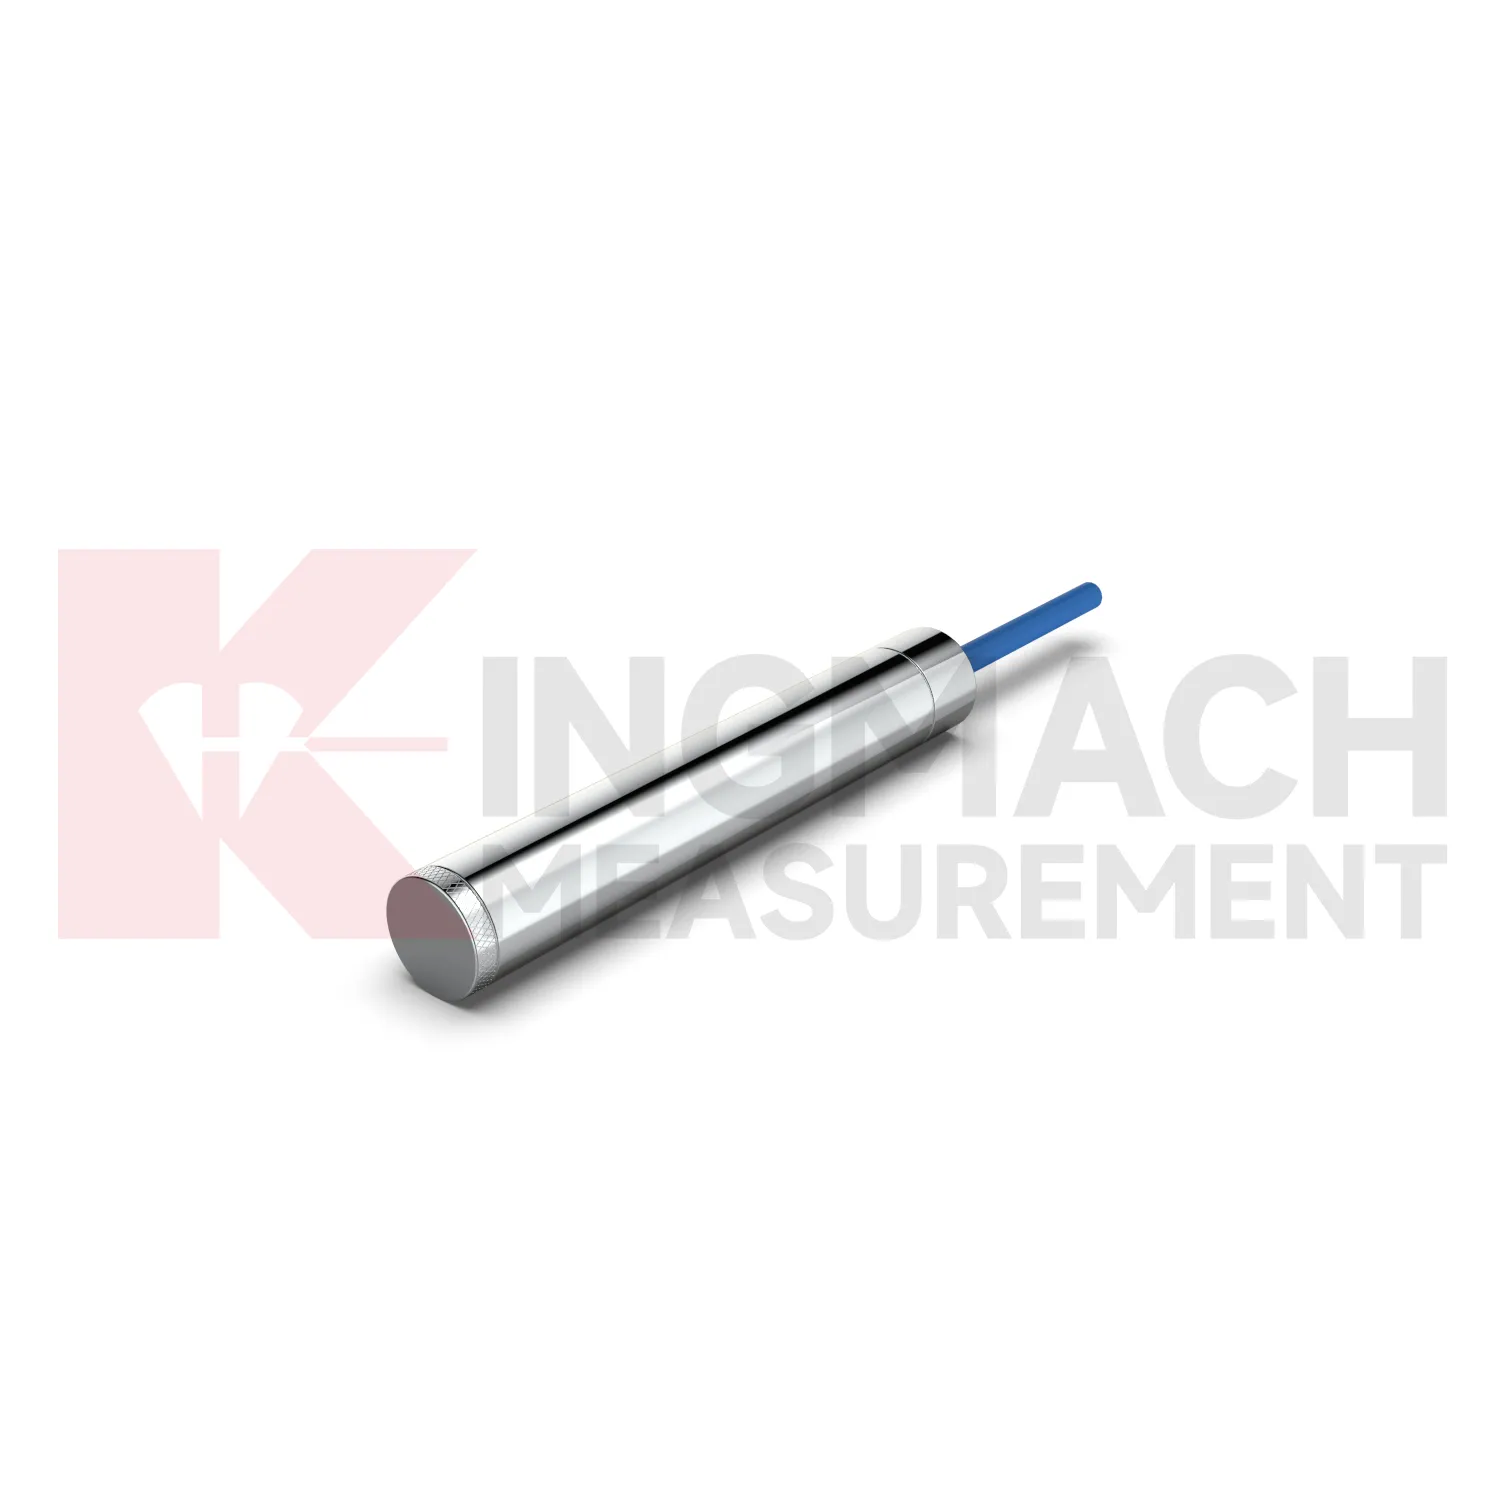
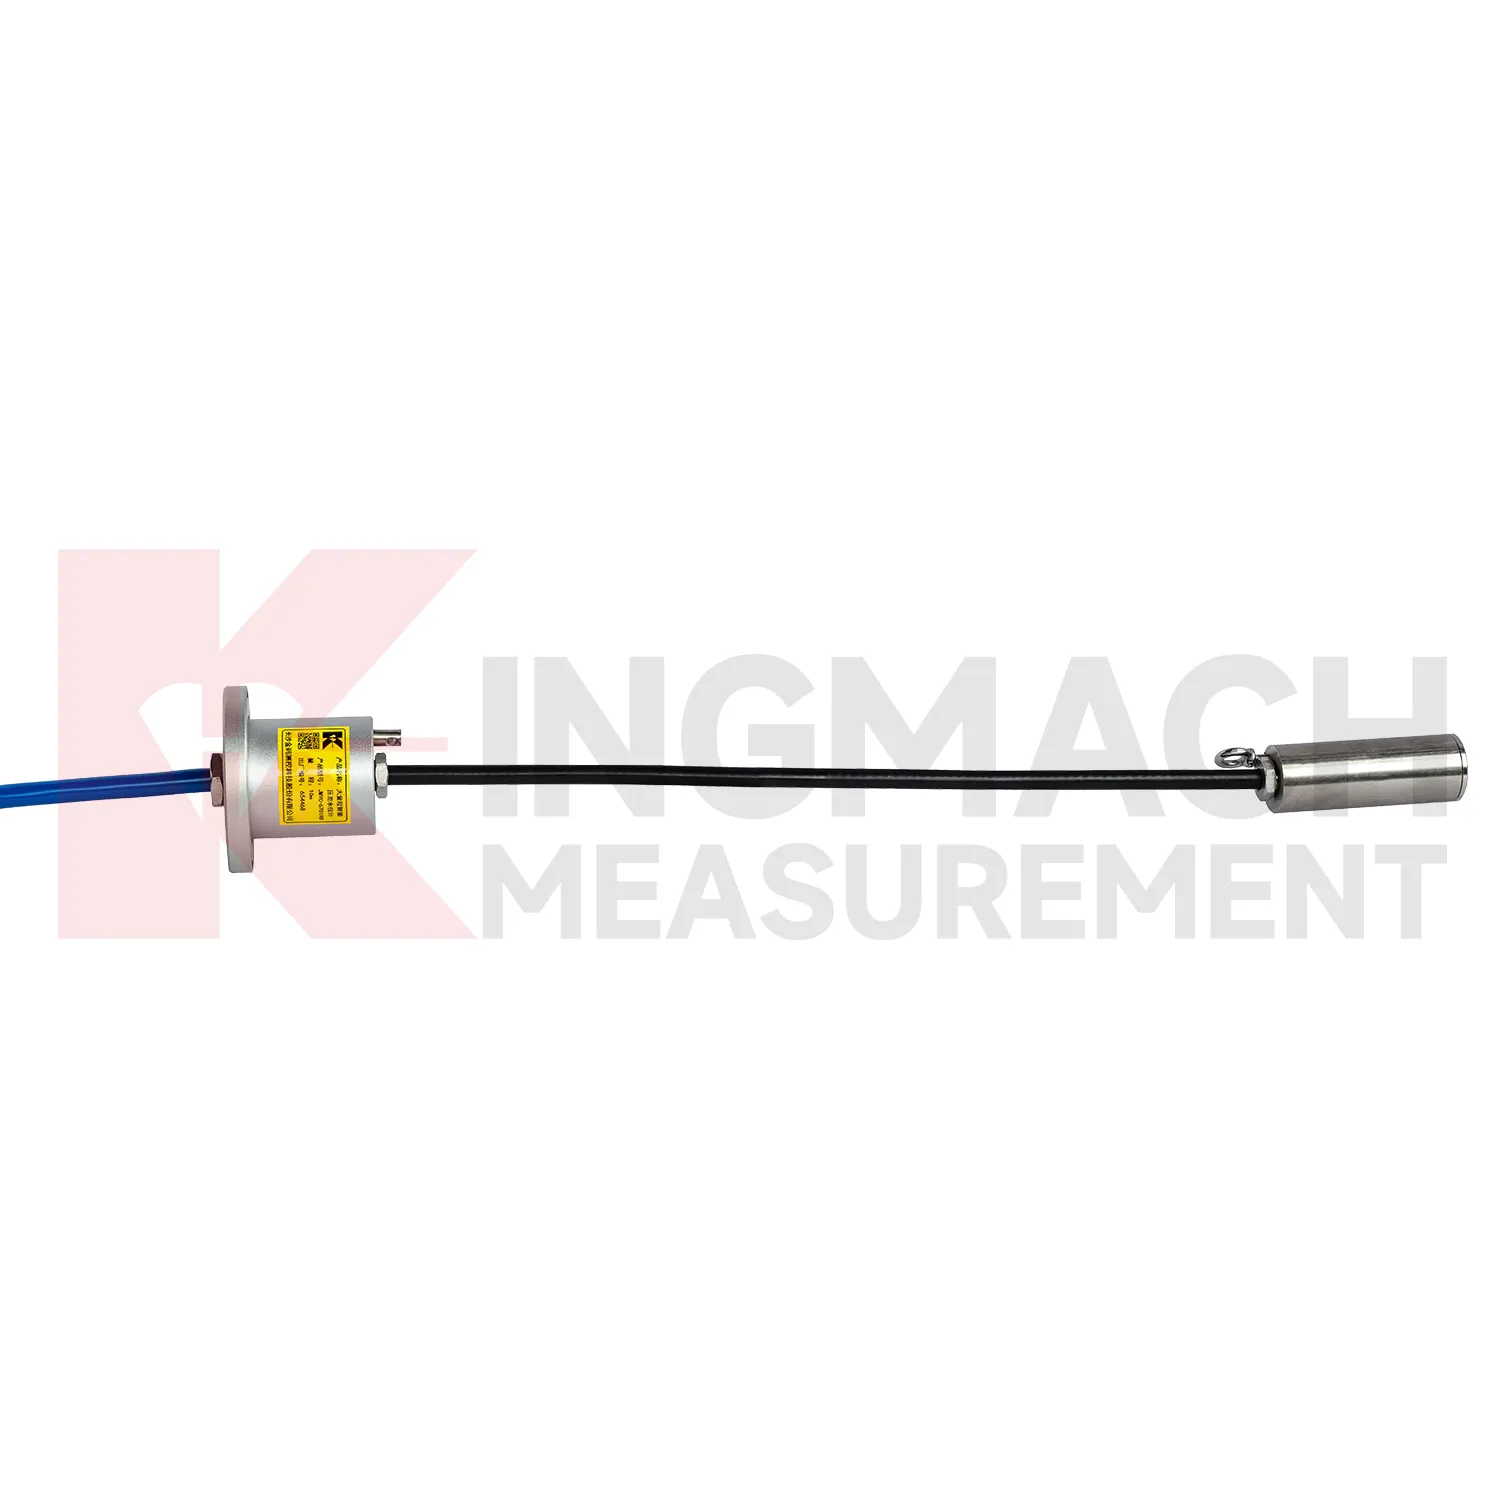
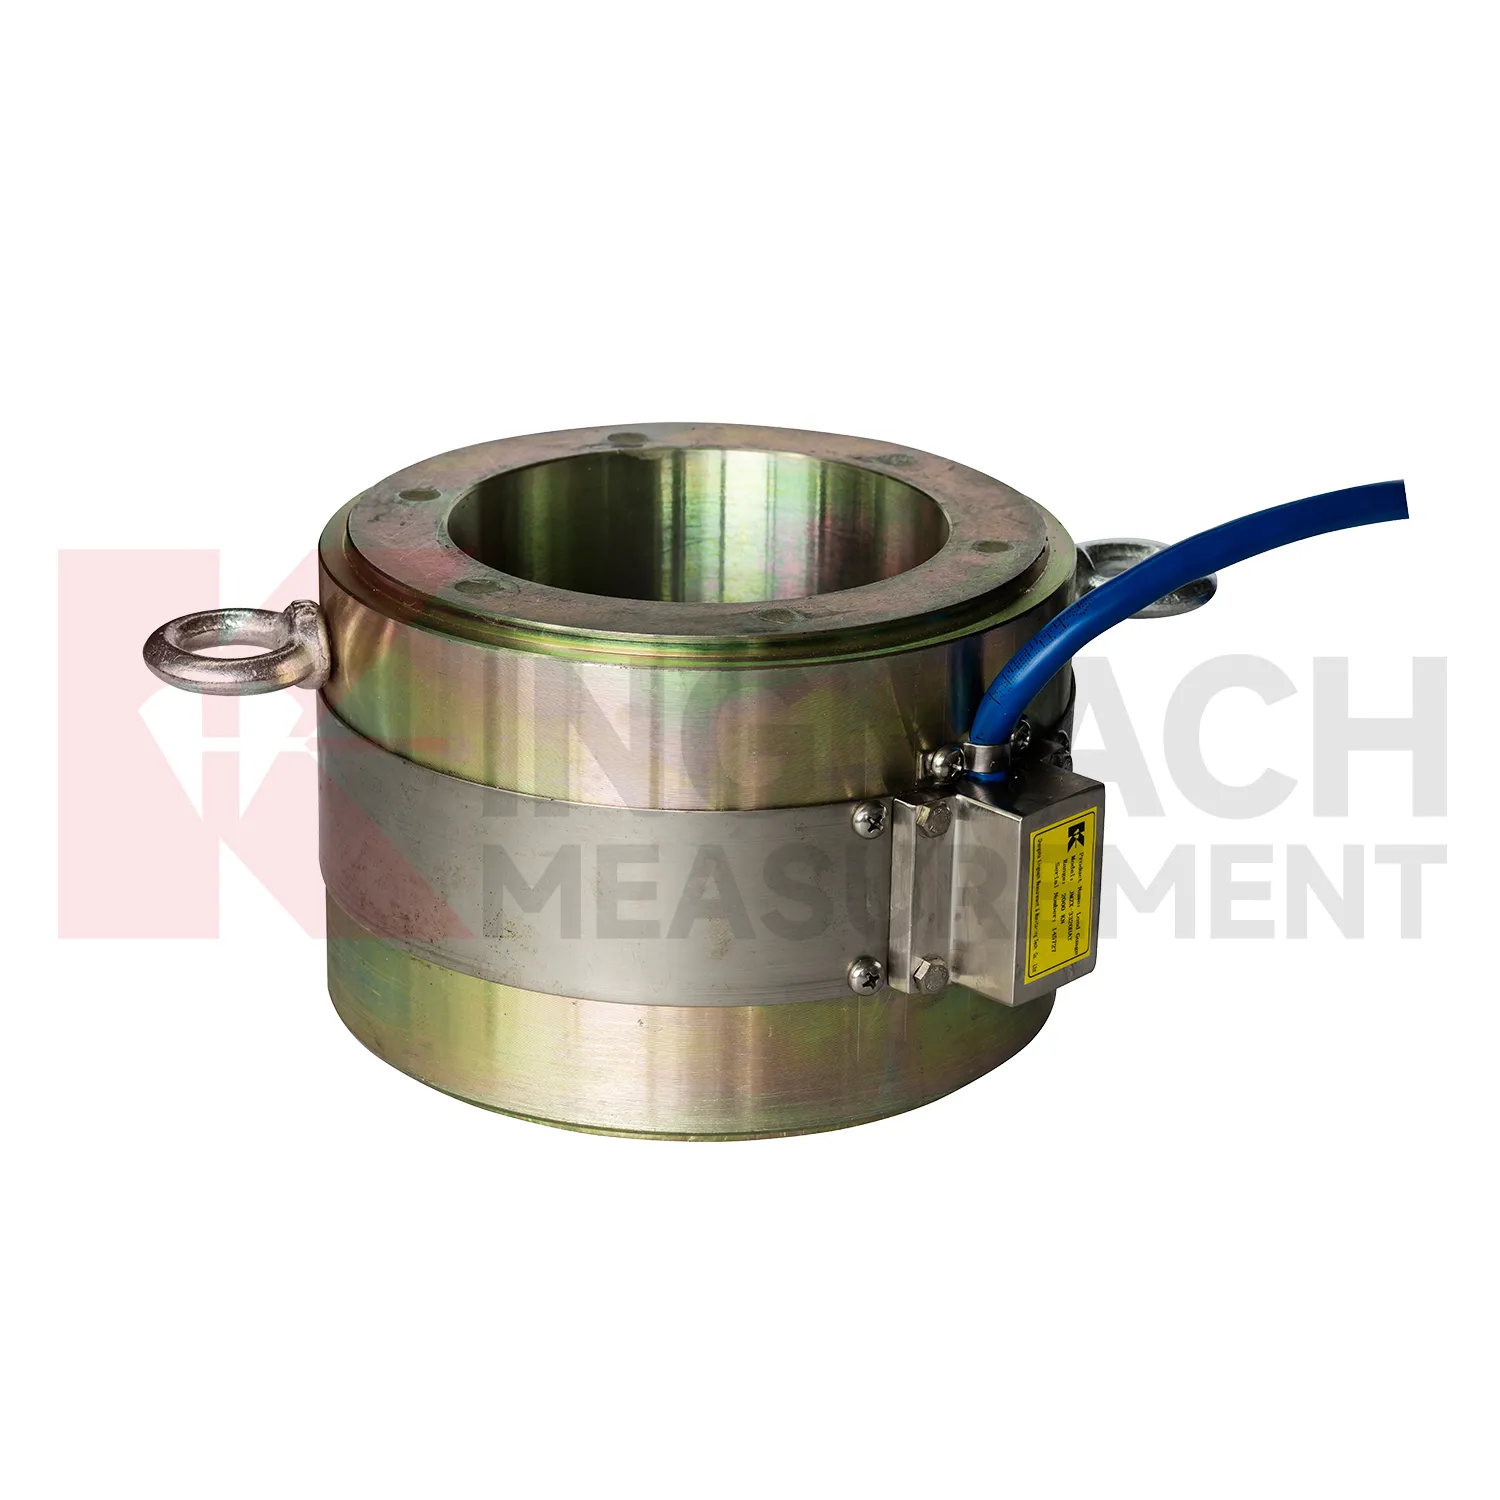
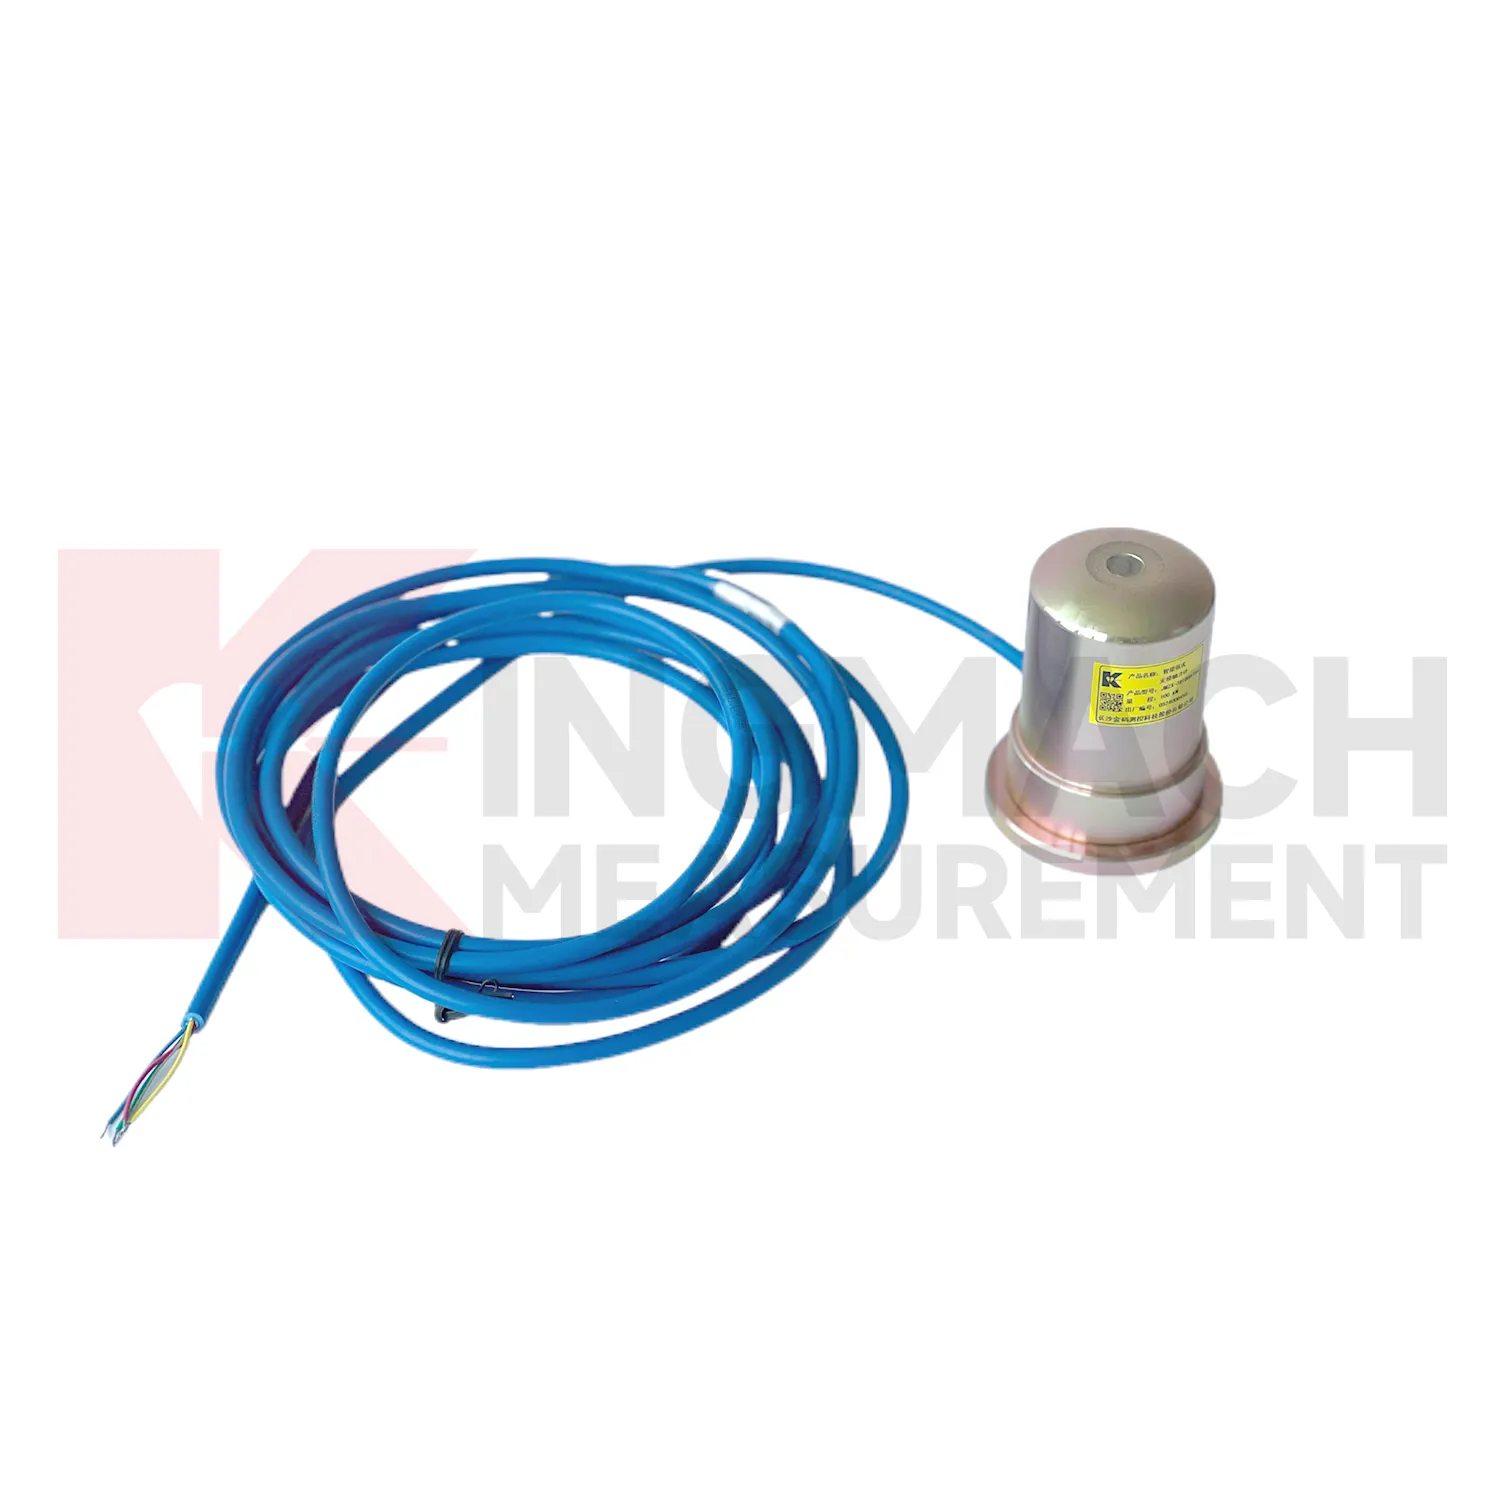
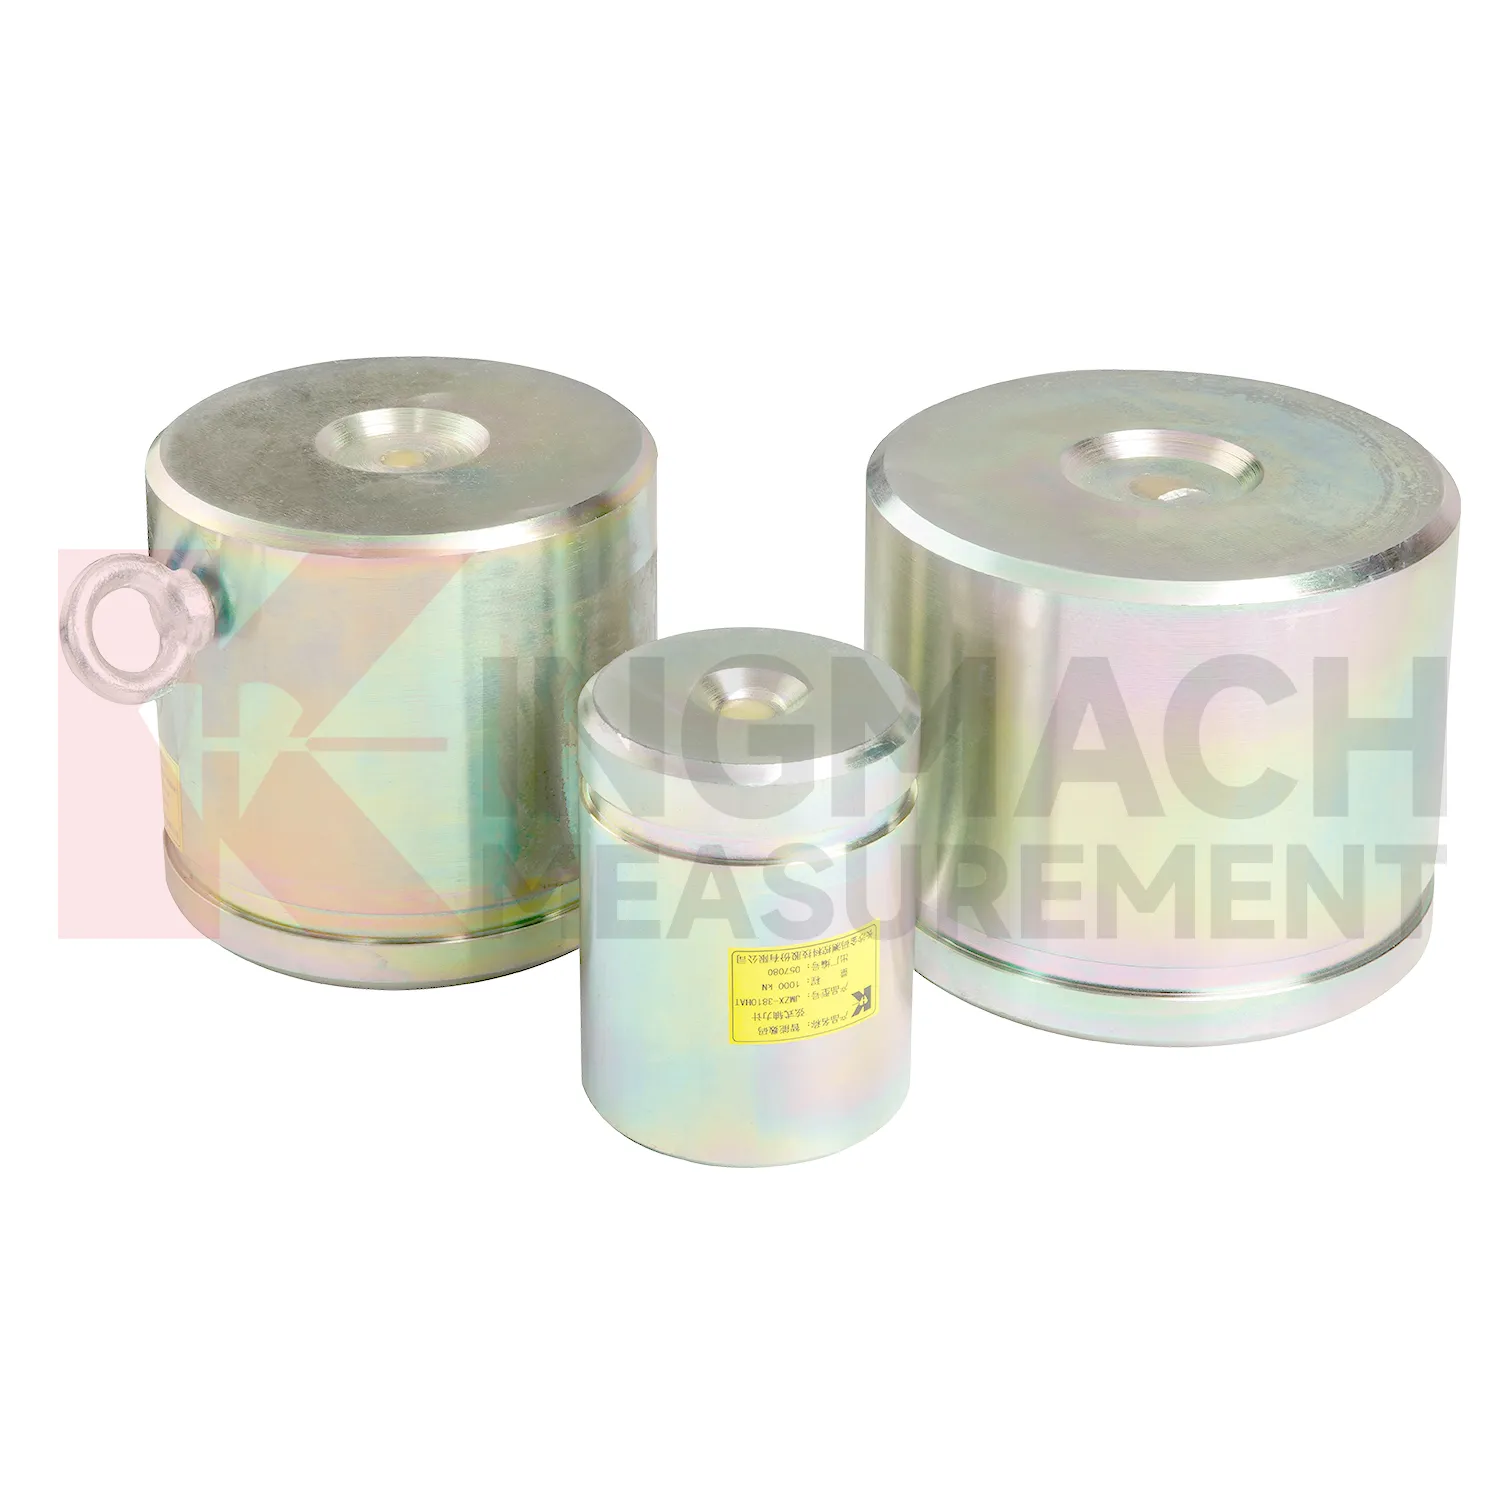
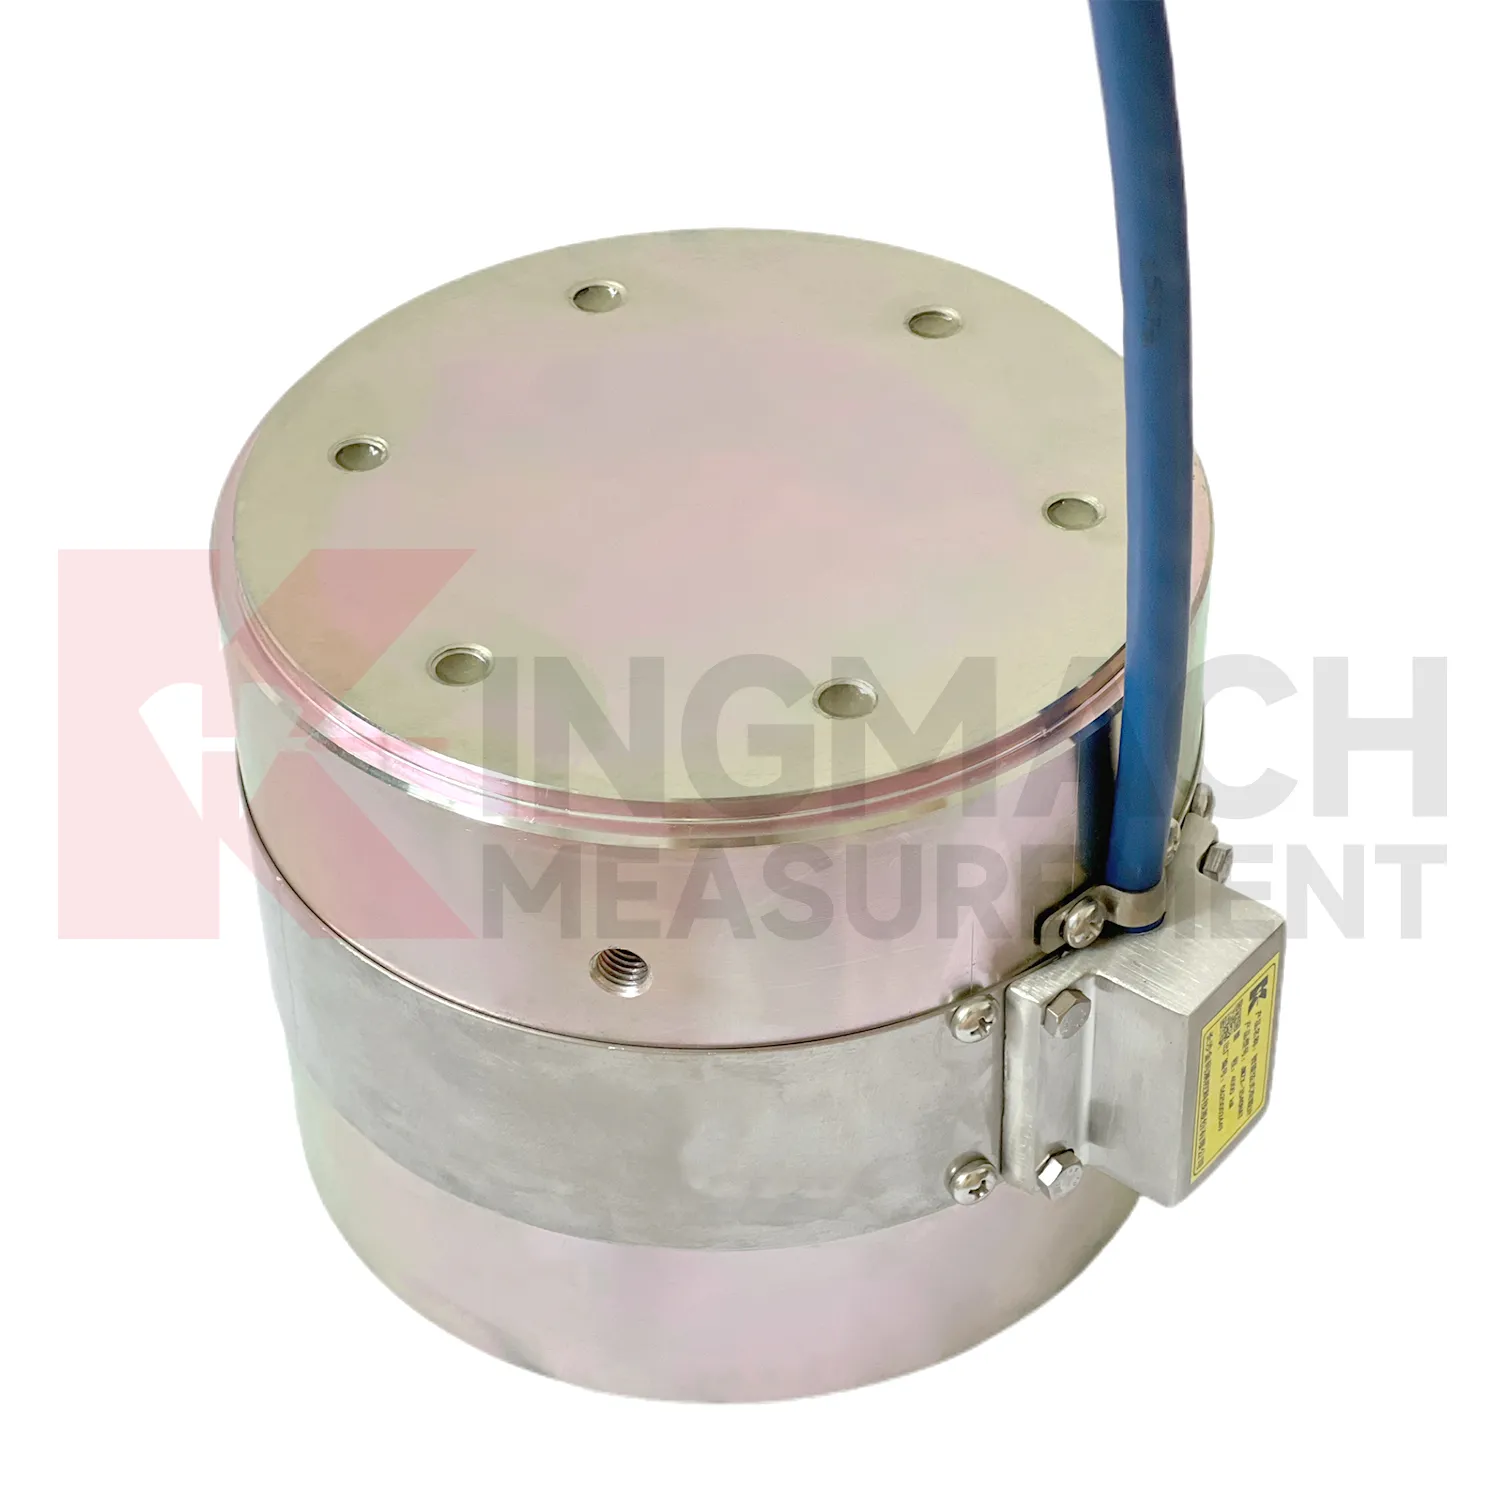
Kingmach load cell connection diagram is developed for civil infrastructure where readings must remain usable after dust, vibration, water, and long cable runs enter the job. Product files describe vibrating wire based designs, smart chips, digital detection, strong anti-interference transmission, waterproof insulation, and automatic temperature correction. On the solid load cell JMZX-35XXHAT, the listed range runs from 1000 kN to 10000 kN with 0.1 kN resolution and 0.5%FS precision. On the hollow JMZX-3XXXHAT series, the listed range covers 500 kN to 8000 kN and the record memory can store 800 measurement entries. On the JMZX-38XXHAT axial force meter, the instrument can display axial force directly in kN. These details suit projects where force monitoring is part of acceptance, construction control, or long term service review. Kingmach's product grouping also supports mixed monitoring networks, where load readings sit beside water level, piezometer, displacement, settlement, and tilt data. For purchasing teams, this means the specification should include not only the sensor body, but also compatible readout equipment, cable length, protection accessories, calibration needs, and the reporting method expected by the owner. That reduces changes after the site work has already started. In practice, this means the specification should name the monitored member, expected reading frequency, installation exposure, and the person responsible for accepting the first stable value.
Application of load cell connection diagram
In railways, highways, and transport corridors, load cell connection diagram can monitor bridge support loads, subgrade pressure, retaining structure forces, and temporary works near active traffic. The difficulty is that access windows are short, vibration is frequent, and data gaps can create uncertainty during maintenance review. Kingmach smart load products support digital output, anti-interference transmission, built-in temperature correction, and stored model or calibration information. Solid load cells list 1000 kN to 10000 kN ranges and 0.5%FS precision, while axial force meters cover 200 kN to 3000 kN for support load points. These specifications suit high capacity structural members and staged construction near operating routes. A monitoring plan should record traffic condition, construction activity, temperature, and any maintenance event near the sensor. For owners, the value lies in trend comparison: whether support loads change after traffic opening, whether subgrade pressure rises after heavy rainfall, or whether temporary structures remain within expected force limits before removal. For transport corridors, the inspection schedule should account for possession windows, traffic vibration, and safe access. Remote acquisition may reduce field visits, but periodic visual checks still catch damaged cables, water entry, and loose junction boxes. Access for inspection should also be planned before backfilling, because later hardware checks may be harder than taking the reading itself.
The future of load cell connection diagram
As monitoring standards become more detailed, load cell connection diagram will be expected to support both engineering judgment and audit trails. Owners want to know whether a force change is real, when it began, how it compares with design stages, and what action followed. Kingmach load products already include technical features such as 0.5%FS precision on major force models, temperature correction, waterproof construction, direct kN display on axial force meters, and stored measurement records on smart designs. Future systems can tie these details to inspection workflows, maintenance orders, and asset management platforms. That means a load reading will not sit alone in a spreadsheet. It will connect to the sensor model, calibration certificate, installation photo, cable route, alarm history, and nearby movement data. Wireless links and AI screening may speed review, but the foundation remains disciplined measurement. The future belongs to force monitoring records that can be checked, repeated, and understood years after installation.
Care & Maintenance of load cell connection diagram
For load cell connection diagram, procurement and maintenance teams should agree on records before the product reaches the site. The box should not arrive as an anonymous device. The file should contain model, range, dimensions, calibration coefficient, certificate requirements, cable length, readout method, and any custom order notes. Axial force meters are often customized, with model, range, and dimension confirmed at order and lead time often planned around 20 to 30 days. During installation, check that the delivered item matches the support diameter, bearing plate layout, and data acquisition plan. During use, keep warranty, calibration, inspection, and repair notes together with the monitoring record. Protect the sensor from overload, impact, water entry, and unauthorized rewiring. If the project changes from manual reading to automated collection, verify scaling and units before comparing new data with older values. Maintenance is easier when the administrative record is as tidy as the hardware installation. Confirm changes before handover.
Kingmach load cell connection diagram
load cell connection diagram is often selected after a project team asks where force can change without being seen. In a tunnel, the answer may be the steel support. In a bridge, it may be a cable anchor or bearing. In a foundation pit, it may be a strut, anchor, or retaining wall contact zone. In a dam, it may be an anchor system affected by water level and temperature. Kingmach's monitoring product family allows these points to be linked with settlement sensors, displacement transducers, tiltmeters, piezometers, data loggers, and software platforms. That wider context matters because load change is rarely isolated. A rising force reading becomes more meaningful when it is checked against movement, pore pressure, and construction activity. A falling force reading may point to relaxation, seating loss, or damage near the bearing surface. The instrument gives the first clue, and the surrounding data explains it. It also makes abnormal values easier to discuss with designers, contractors, and maintenance teams.
FAQ
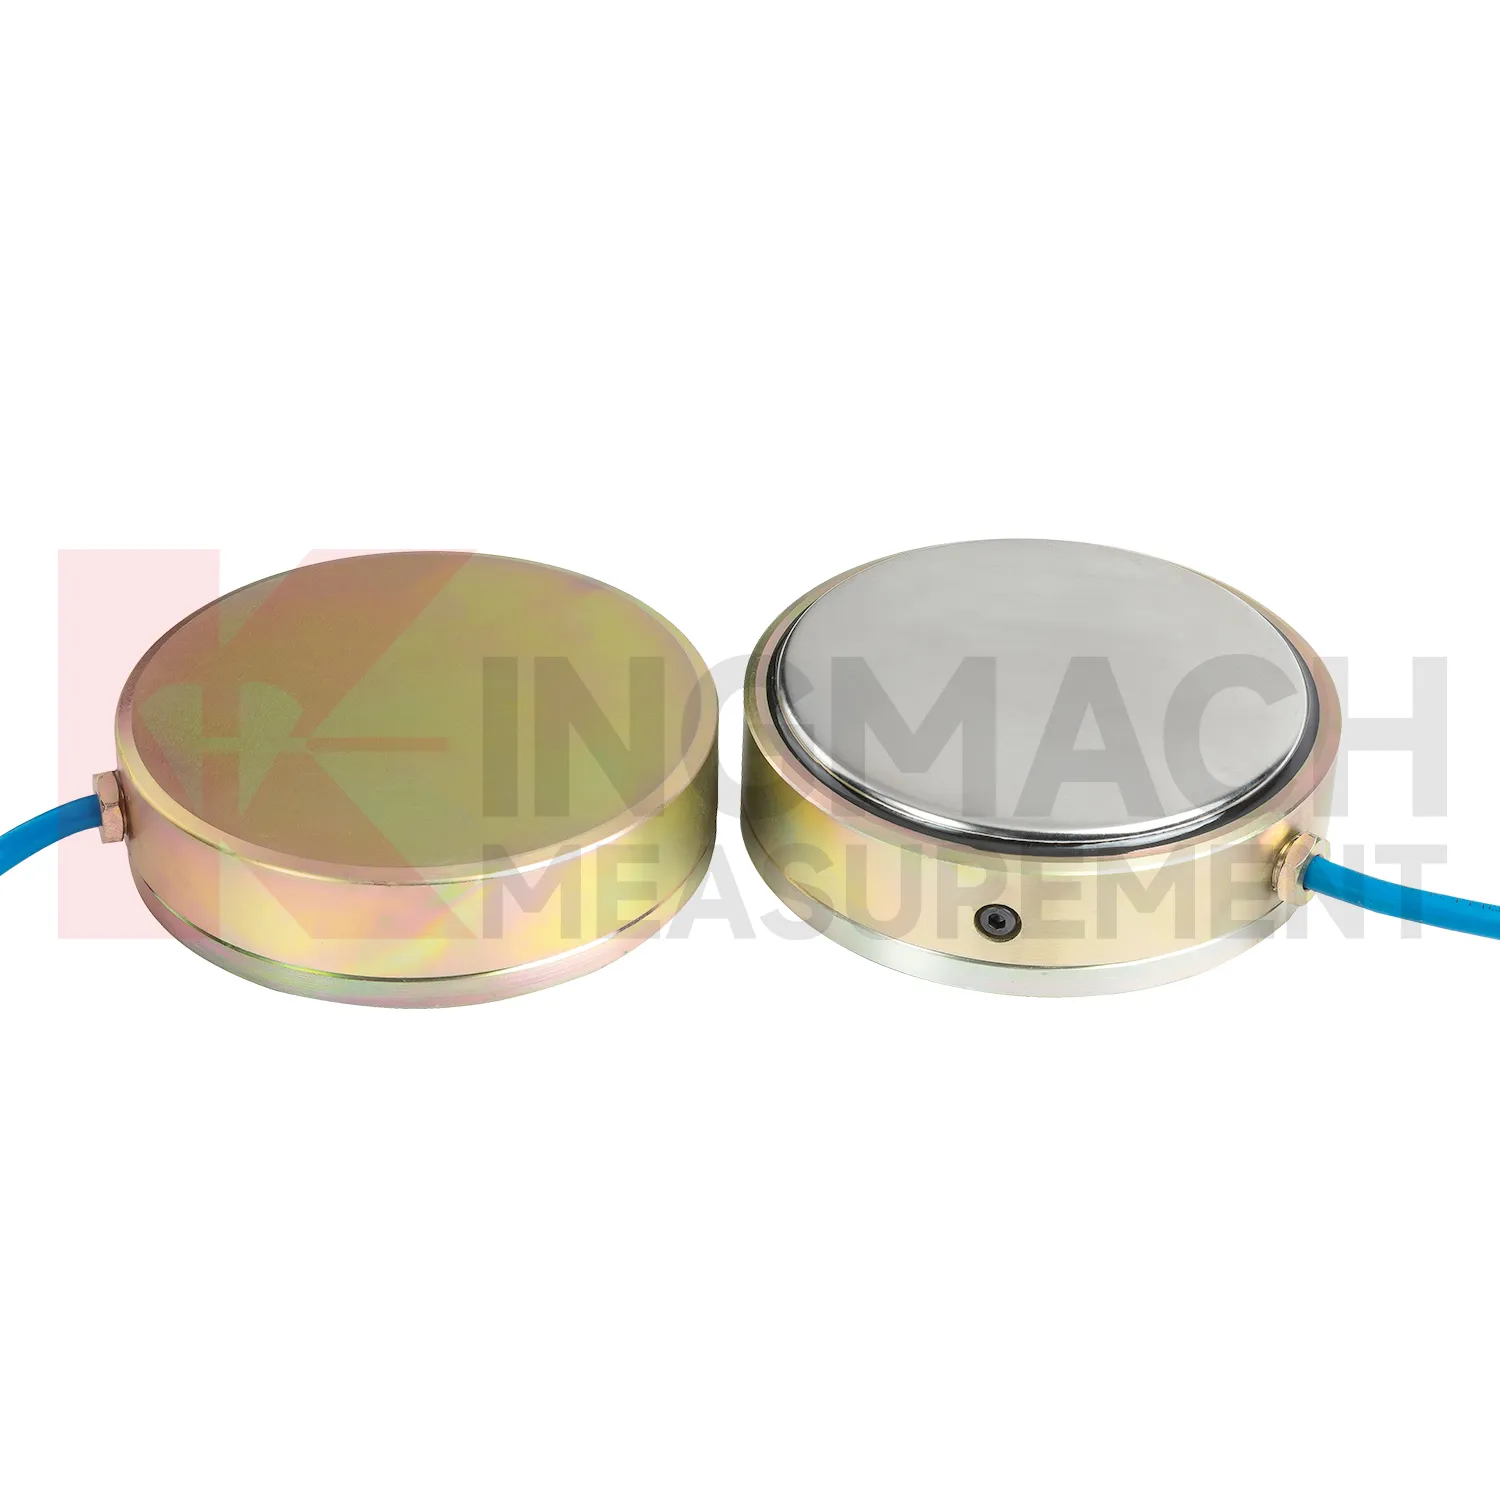
Q: Can load cell connection diagram be used for soil pressure or retaining wall pressure? A: Yes, pressure related models such as earth pressure cells are used where the measured value is contact pressure rather than direct member force. Q: What ranges are listed for Kingmach earth pressure cells? A: The JMZX-50XXAT/ATM family lists 0.3 MPa, 0.6 MPa, 1 MPa, 2 MPa, 4 MPa, 6 MPa, and 8 MPa ranges. Q: What accuracy and resolution are listed? A: The product file gives 0.001 MPa pressure resolution, 0.5%FS pressure accuracy, and ±0.5°C temperature accuracy. Q: Where are these readings useful? A: Foundation pits, dams, slopes, retaining walls, embankments, tunnels, and buried structures. Q: What maintenance issue is most common? A: Cable damage, water entry, channel confusion, and poor installation records cause many field doubts.
Reviews
Andrew Lee
The visualization software is intuitive and powerful. It helps us analyze monitoring data efficiently.
Christopher Martinez
Very satisfied with the readouts & data loggers. User-friendly interface and supports multiple sensor inputs.
Latest Inquiries
To protect the privacy of our buyers, only public service email domains like Gmail, Yahoo, and MSN will be displayed. Additionally, only a limited portion of the inquiry content will be shown.
Emma***@gmail.comCanada
Dear Sir/Madam, we are interested in displacement transducers and settlement sensors for a geotechni...
Sophia***@gmail.comUnited Kingdom
Good day, we need environmental monitoring sensors including temperature, humidity, and wind sensors...