
 EN
EN
 ar
ar bg
bg hr
hr cs
cs da
da nl
nl fi
fi fr
fr de
de el
el hi
hi it
it ko
ko no
no pl
pl pt
pt ro
ro ru
ru es
es sv
sv tl
tl iw
iw id
id lv
lv lt
lt sr
sr sk
sk sl
sl uk
uk vi
vi et
et hu
hu th
th tr
tr fa
fa ms
ms hy
hy ka
ka ur
ur bn
bn mn
mn ta
ta kk
kk uz
uz ku
ku
NB-IoT DTU
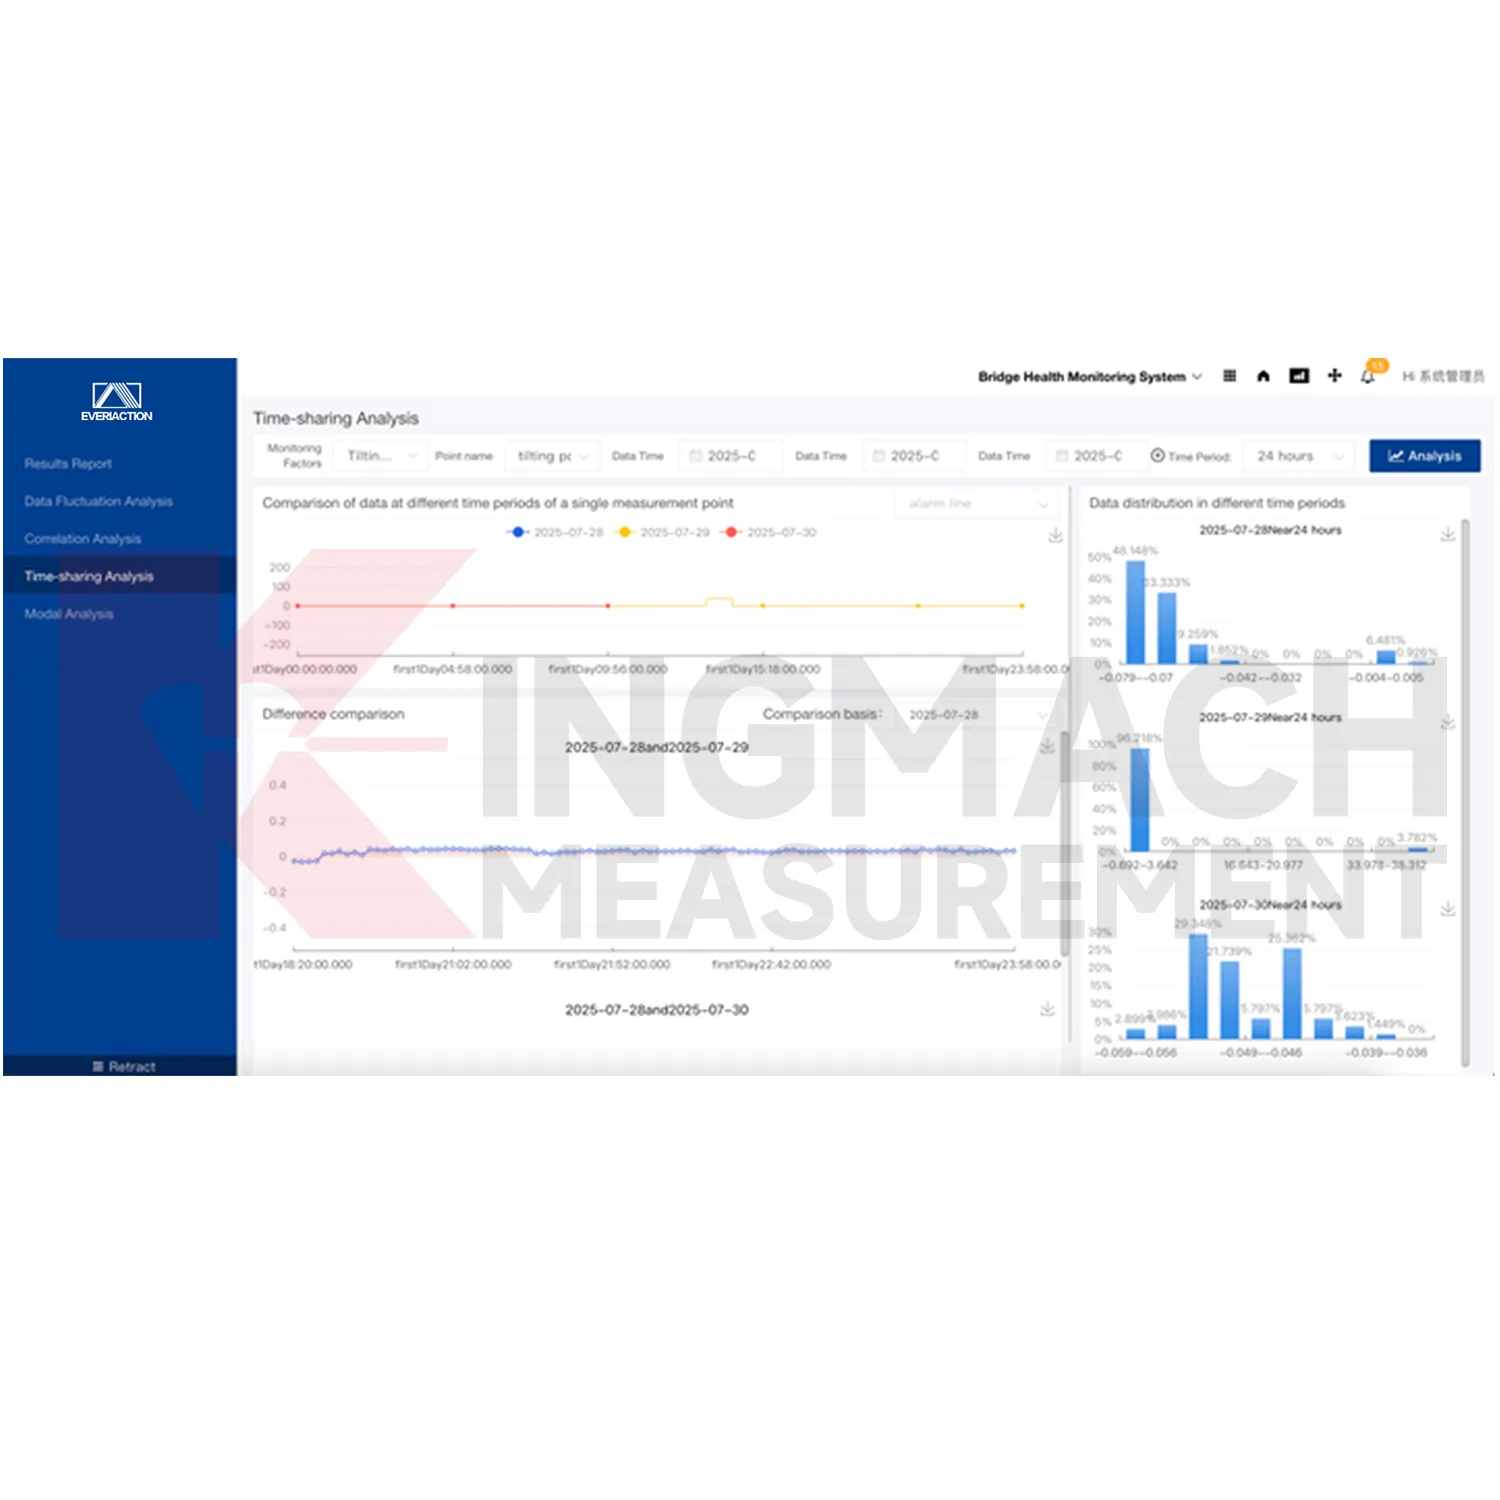
Kingmach NB-IoT DTU includes functions for fast storage, real-time filtering, efficient analysis, complex statistics, user-friendly display, and personalized customization of collected data. These functions help the user move from channel values to engineering understanding. Trend curves can show whether a point is stable, rising, falling, or reacting to weather and construction events. Filtering can reduce distractions before review. Custom display layouts help different users see the data they need for daily operation, risk review, or management reporting.
Application of NB-IoT DTU
Dam and hydraulic structure monitoring uses Kingmach NB-IoT DTU to manage water level, seepage, deformation, settlement, temperature, pressure, and gallery inspection records. These assets require long-term data continuity and careful alarm handling. The platform can store multi-dimensional data, show trends, and maintain project documents around the same asset. When an abnormal pattern appears, reviewers can compare the value with water level, rainfall, maintenance notes, and related sensors before deciding the next field action.
The future of NB-IoT DTU
Future use of Kingmach NB-IoT DTU will grow as civil engineering monitoring moves from isolated instrument readings to connected asset management. More structures will rely on sensors, acquisition modules, wireless devices, and cloud platforms to maintain a continuous safety record. The software layer will become the place where owners review not just one reading, but the relationship between trends, alarms, inspections, weather, construction, and maintenance work. A platform that integrates multiple data sources will be central to that shift.
Care & Maintenance of NB-IoT DTU
Dashboard maintenance for Kingmach NB-IoT DTU should follow the needs of users, not just the number of available widgets. Operators need quick status, active alarms, and recent data quality. Engineers may need trend comparison, related channels, statistics, and event notes. Managers may need report summaries and project status. Review dashboard layouts after real use begins, then remove clutter and add views that help decisions. A clean visual layout keeps important changes easier to notice.
Kingmach NB-IoT DTU
Kingmach NB-IoT DTU turns scattered field readings into a project view that engineers, owners, and maintenance teams can actually use. A monitoring site may include strain gauges, load cells, displacement meters, settlement sensors, tiltmeters, water-level instruments, environmental sensors, accelerometers, acquisition modules, and data loggers. Without a central platform, each channel can become a separate file or screen. The Monitoring system software platform receives and stores multi-dimensional monitoring data in real time, then presents trends, alarms, reports, and project records in a clearer form. This helps users understand the status of bridges, tunnels, slopes, buildings, dams, subgrades, and foundation pits before small changes become difficult to trace.
FAQ
Q: How are trend curves used?
A: They help compare current readings with earlier behavior so gradual movement, sudden jumps, or event response can be reviewed.
Q: What does real-time filtering help with?
A: It reduces noisy or distracting records before users study the channel history.
Q: How do alarms guide action?
A: Configured rules point users toward the affected point, severity level, time, and related follow-up record.
Q: What makes reports easier?
A: Stored trends, alarms, project files, and expert review notes can be gathered without rebuilding the evidence manually.
Q: Why is graphical display useful?
A: Graphs help users see movement direction, timing, and abnormal patterns faster than raw tables alone.
Reviews
Christopher Martinez
Very satisfied with the readouts & data loggers. User-friendly interface and supports multiple sensor inputs.
Robert Taylor
The weir flow meter is well-built and delivers accurate measurements. Great value for water management applications.
Latest Inquiries
To protect the privacy of our buyers, only public service email domains like Gmail, Yahoo, and MSN will be displayed. Additionally, only a limited portion of the inquiry content will be shown.
Amelia***@gmail.comSingapore
Hello, I am looking for visualization software for monitoring system data analysis. Please let me kn...
Olivia***@gmail.comUnited States
Hello, we are currently sourcing high-precision strain gauges and load cells for a bridge monitoring...